Neste post iremos finalizar nosso artigo construindo uma aplicação para apresentar o nosso mapa de calor. Para isso você vai precisar para construir o aplicativo em algum lugar que seja acessível por um navegador web.
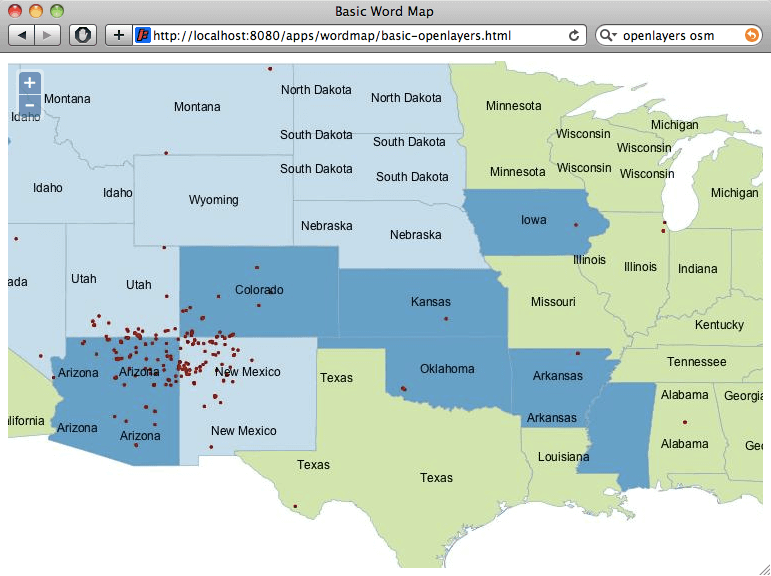
O mapa simples que podemos desenvolver usa apenas uma página com OpenLayers que mostra um mapa base e nossa camada WMS (geonames). Para isso você vai precisar de dois arquivos, basic-openlayers.html e basic-openlayers.js. No documento HTML coloque o seguinte:
<html>
  <head>
    <title>Basic Word Map</title>
    <script src="http://www.openlayers.org/api/2.12/OpenLayers.js"></script>
    <script src="basic-openlayers.js"></script>
  </head>
  <body onLoad="initMap()">
  <div id="map"></div>
  </body>
</html>
<html>
  <head>
    <title>Basic Word Map</title>
    <script src="http://www.openlayers.org/api/2.12/OpenLayers.js"></script>
    <script src="basic-openlayers.js"></script>
  </head>
  <body onLoad="initMap()">
  <div id="map"></div>
  </body>
</html>
O documento HTML apenas faz referência ao nosso arquivo javascript (OpenLayers) do aplicativo, e estabelece uma chamada “map” para realizar o vínculo com o OpenLayers. No documento JavaScript, coloque o seguinte código:
function initMap() {
  // Create the map
  var map = new OpenLayers.Map("map");
  // Create a WMS layer, with a base layer (states) and names layer (geonames)
  var wms = new OpenLayers.Layer.WMS("GeoServer WMS",
    "http://localhost:8080/geoserver/wms",
    {
      layers: "usa:states,opengeo:geonames"
    });
  // Set the word parameter for the geonames layer
  var myWord = "Navajo";
  wms.mergeNewParams({viewparams: "word:" + myWord});
  // Add the layer to the map and center the map on the USA
  map.addLayer(wms);
  map.setCenter(new OpenLayers.LonLat(-100, 38), 5);
}
O arquivo Javascript usa como base a camada “states” do GeoServer para servir como contexto para a camada “geonames”.

Agora altere o valor da váriavel “myWord” e recarregue a página para ver os diferentes resultados no mapa.
Isto é muito interessante, mas seria ainda melhor se pudéssemos digitar uma palavra e imediatamente ver a mudança do mapa, sem precisar recarregá-la. Queremos também visualizar os resultados através de um mapa de calor, não apenas um mapa de pontos!
Para construir nossa aplicação final, usaremos o ExtJS, com a biblioteca GeoExt. Assim como acontece com os exemplos do OpenLayers, a página HTML do ExtJS é muito simples, pois é apenas um lugar para declarar as referências das bibliotecas que serão utilizadas.
<html>
  <head>
    <title>OpenGeo Word Map</title>
    <!-- ExtJS Scripts and Styles -->
    <script type="text/javascript" src="http://cdn.sencha.com/ext/gpl/3.4.1.1/adapter/ext/ext-base.js"></script>
    <script type="text/javascript" src="http://cdn.sencha.com/ext/gpl/3.4.1.1/ext-all.js"></script>
    <link rel="stylesheet" type="text/css" href="http://cdn.sencha.com/ext/gpl/3.4.1.1/resources/css/ext-all.css" />
    <link rel="stylesheet" type="text/css" href="http://cdn.sencha.com/ext/gpl/3.4.1.1/examples/shared/examples.css" />
    <!-- OpenLayers Script -->
    <script src="http://www.openlayers.org/api/2.12/OpenLayers.js"></script>
    <!-- GeoExt Script -->
    <script type="text/javascript" src="http://api.geoext.org/1.1/script/GeoExt.js"></script>
    <!-- Our Application -->
    <script type="text/javascript" src="wordmap-simple.js"></script>
  </head>
  <body>
  </body>
</html>
Você pode perceber que no arquivo HTML acima, são declaradas as bibliotecas ExtJS, GeoExt, OpenLayers e também o documento “wordmap-simple.js” que nada mais é que a nossa aplicação. Veja:
// Use this word on startup
var startWord = "Ocean";
// Base map
var osmLayer = new OpenLayers.Layer.OSM();
// Point map
var wmsLayer = new OpenLayers.Layer.WMS("WMS", "http://localhost:8080/geoserver/wms", {
  format: "image/png",
  transparent: true,
  layers: "opengeo:geonames",
  styles: "point"
}, {
  opacity: 0.6,
  singleTile: true,
});
// Start with map of startWord
wmsLayer.mergeNewParams({viewparams: "word:"+startWord});
Tal como acontece com o nosso exemplo simples, começamos definindo nossas camadas: o OpenStreetMap como mapa base; e a nossa camada WMS. Temos algumas opções extras na definição da camada WMS no OpenLayers, pois a definimos para ter um fundo transparente, e uma opacidade parcial, isso para sobrepor o mapa base.
Nós também definimos uma variável com nome de “startWord”, que irá iniciar o mapeamento da aplicação ao setá-la no parâmetro da URL.
Agora as coisas começam a ficam um pouco mais complicadas:
// Map with projection into (required when mixing base map with WMS)
olMap = new OpenLayers.Map({
  projection: "EPSG:900913",
  center: [-10764594.0, 4523072.0],
  units: "m",
  layers: [wmsLayer, osmLayer],
  zoom: 4
});
Como estamos misturando um mapa WMS e um mapa do OSM, nós precisamos:
1. Garantir que a camada WMS declare a projeção que está usando, que deve ser a Mercator para coincidir com o mapa base (OSM); e,
2. Garantir que o ponto central está convertido em Mercator antes de ser iniciado o mapa.
Agora que o mapa está configurado, só precisamos reunir os componentes ExtJS em uma aplicação:
// Text field component. On 'enter' update the WMS URL
var textField = new Ext.form.TextField({
  value: startWord,
  listeners: {
    specialkey: function(fld, e) {
      // Only update the map when the user hits 'enter'
      if (e.getKey() == e.ENTER) {
        wmsLayer.mergeNewParams({viewparams: "word:"+fld.getValue()});
      }
    }
  }
});
Para introduzir novas palavras precisamos de um campo de texto na tela. Quando o usuário clicar, ele deve pegar o evento e atualizar a camada (WMS).
// Map panel, with text field embedded in top toolbar
var mapPanel = new GeoExt.MapPanel({
  title: "OpenGeo Geonames Heat Map",
  tbar: ["Enter a word to map:", textField],
  map: olMap
});
Agora iremos adicionar um painel com o campo de texto embutido na barra de ferramentas no topo da tela:
// Viewport wraps map panel in full-screen handler
var viewPort = new Ext.Viewport({
  layout: "fit",
  items: [mapPanel]
});
// Start the app!
Ext.onReady(function () {
  viewPort.show();
});
Para finalizamos nossa aplicação vamos ver como ficou o nosso código em um único bloco:
// Use this word on startup
var startWord = "ocean";
// Base map
var osmLayer = new OpenLayers.Layer.OSM();
// Heat map + point map
var wmsLayer = new OpenLayers.Layer.WMS("WMS",
  // Uncomment below to use your local server
  // "http://localhost:8080/geoserver/wms",
  "http://apps.opengeo.org/geoserver/wms",
  {
    format: "image/png8",
    transparent: true,
    layers: "opengeo:geonames,opengeo:geonames",
    styles: "point,heatmap"
  }, {
    opacity: 0.6,
    singleTile: true,
  });
// Start with map of startWord
wmsLayer.mergeNewParams({viewparams: "word:"+startWord});
// Map with projection into (required when mixing base map with WMS)
olMap = new OpenLayers.Map({
  projection: "EPSG:900913",
  units: "m",
  layers: [wmsLayer, osmLayer],
  center: [-10764594.0, 4523072.0],
  zoom: 4
});
// Take in user input, fire an event when complete
var textField = new Ext.form.TextField({
  value: startWord,
  listeners: {
    specialkey: function(field, e) {
      // Only update the word map when user hits 'enter'
      if (e.getKey() == e.ENTER) {
        wmsLayer.mergeNewParams({viewparams: "word:"+field.getValue()});
      }
    }
  }
});
// Map panel, with text field embedded in top toolbar
var mapPanel = new GeoExt.MapPanel({
  title: "OpenGeo Geonames Heat Map",
  tbar: ["Enter a word to map:", textField],
  map: olMap
});
// Viewport wraps map panel in full-screen handler
var viewPort = new Ext.Viewport({
  layout: "fit",
  items: [mapPanel]
});
// Start the app!
Ext.onReady(function () {
  viewPort.show();
});
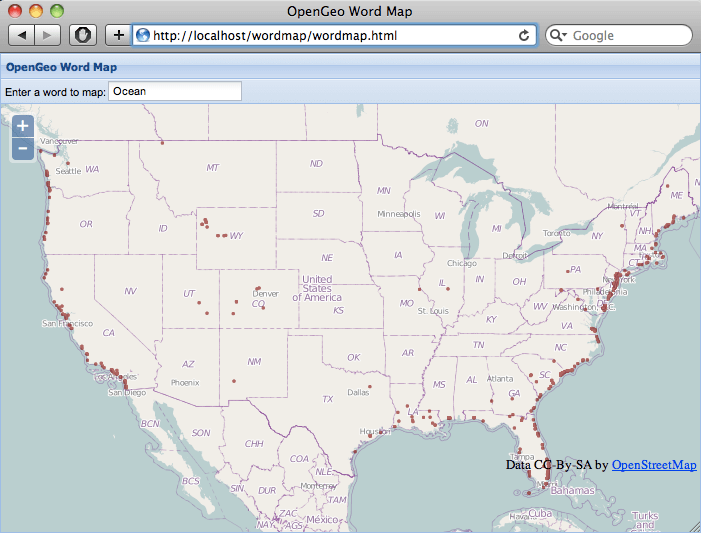
Veja agora como ficou o nosso mapa:

Assim, ficou uma aplicação muito bonita, mas foi prometido um mapa de calor, e até agora, este é apenas um mapa de pontos! Nós precisamos adicionar um estilo de mapa de calor:
1. Clique em “Style” na barra de navegação do GeoServer
2. Selecione “Add new style”
3. Adicione o nome do estilo como “heatmap”
4. Cole o código abaixo na área de código
<?xml version="1.0" encoding="ISO-8859-1"?>
<StyledLayerDescriptor version="1.0.0"
   xsi:schemaLocation="http://www.opengis.net/sld StyledLayerDescriptor.xsd"
   xmlns="http://www.opengis.net/sld"
   xmlns:ogc="http://www.opengis.net/ogc"
   xmlns:xlink="http://www.w3.org/1999/xlink"
   xmlns:xsi="http://www.w3.org/2001/XMLSchema-instance">
  <NamedLayer>
    <Name>Heatmap</Name>
    <UserStyle>
      <Title>Heatmap</Title>
      <Abstract>A heatmap surface</Abstract>
      <FeatureTypeStyle>
        <Transformation>
         <ogc:Function name="gs:Heatmap">
           <ogc:Function name="parameter">
             <ogc:Literal>data</ogc:Literal>
           </ogc:Function>
           <ogc:Function name="parameter">
             <ogc:Literal>radiusPixels</ogc:Literal>
             <ogc:Function name="env">
               <ogc:Literal>radius</ogc:Literal>
               <ogc:Literal>100</ogc:Literal>
             </ogc:Function>
           </ogc:Function>
           <ogc:Function name="parameter">
             <ogc:Literal>pixelsPerCell</ogc:Literal>
             <ogc:Literal>10</ogc:Literal>
           </ogc:Function>
           <ogc:Function name="parameter">
             <ogc:Literal>outputBBOX</ogc:Literal>
             <ogc:Function name="env">
               <ogc:Literal>wms_bbox</ogc:Literal>
             </ogc:Function>
           </ogc:Function>
           <ogc:Function name="parameter">
             <ogc:Literal>outputWidth</ogc:Literal>
             <ogc:Function name="env">
               <ogc:Literal>wms_width</ogc:Literal>
             </ogc:Function>
           </ogc:Function>
           <ogc:Function name="parameter">
             <ogc:Literal>outputHeight</ogc:Literal>
             <ogc:Function name="env">
               <ogc:Literal>wms_height</ogc:Literal>
             </ogc:Function>
           </ogc:Function>
         </ogc:Function>
        </Transformation>
        <Rule>
          <RasterSymbolizer>
          <!-- specify geometry attribute to pass validation -->
            <Geometry>
              <ogc:PropertyName>geom</ogc:PropertyName>
            </Geometry>
            <Opacity>0.6</Opacity>
            <ColorMap type="ramp" >
              <ColorMapEntry color="#FFFFFF" quantity="0"    label="nodata" opacity="0" />
              <ColorMapEntry color="#FFFFFF" quantity="0.02" label="nodata" opacity="0" />
              <ColorMapEntry color="#4444FF" quantity=".1"   label="nodata" />
              <ColorMapEntry color="#FF0000" quantity=".5"   label="values" />
              <ColorMapEntry color="#FFFF00" quantity="1.0"  label="values" />
            </ColorMap>
          </RasterSymbolizer>
        </Rule>
      </FeatureTypeStyle>
    </UserStyle>
  </NamedLayer>
</StyledLayerDescriptor>
Em seguida, clique no botão “Salvar”, e está pronto o nosso estilo heatmap! (Os parâmetros do estilo são explicados aqui).
Ao invocar a função gs:Heatmap no estilo, o GeoServer está utilizando o método heatmap disponível no serviço WPS (Web Process Service), que realiza o processamento e disponibiliza a camada através do WMS.
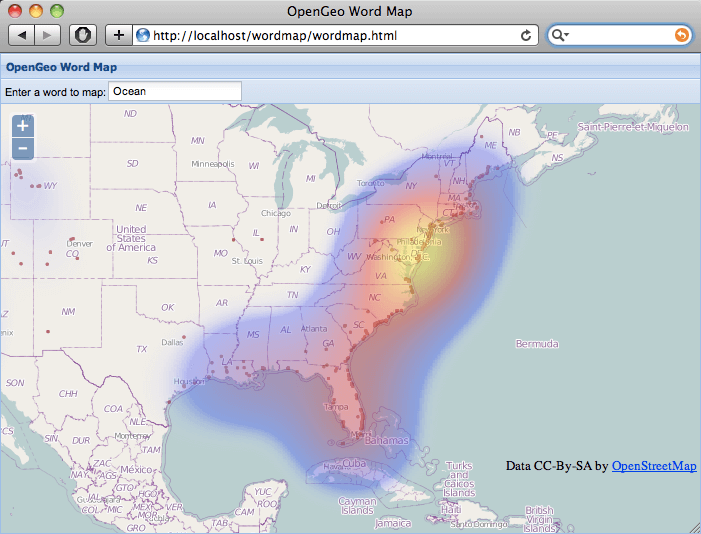
Para ativar o mapa de calor em nossa aplicação, nós só precisamos especificar esse estilo em nossa camada WMS. Então vamos fazer esta mudança na aplicação:
// Heat map + point map
var wmsLayer = new OpenLayers.Layer.WMS("WMS", "http://localhost:8080/geoserver/wms", {
  format: "image/png",
  transparent: true,
  layers: "opengeo:geonames,opengeo:geonames",
  styles: "point,heatmap"
}, {
  opacity: 0.6,
  singleTile: true,
});
Note que, em vez de substituir o nosso estilo de ponto, estamos adicionando um estilo heatmap a mesma camada (opengeo:GeoNames) uma segunda vez. Isso nos permite ver os pontos originais, bem como o mapa de calor.

Este tutorial é uma tradução e adaptação livre do artigo “Building a GeoNames Heat Map” publicado no site da Boundless.
Fonte: Boundless
